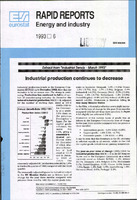
| dc.description.abstract | Industrial production trends in the European Com-munity (EUR12) up to December 1992 show that the recession is by no means over. _The slump is conti-nuing. Production has continued to fall in all sec-tors of manufacturing industry. In December the index of industrial production (NACE 1-4), adjusted for the number of working days, stood at 107.6 ( 1985= 100) for Annual Growth Rate 1992/ 1991 the Communi-ty as a whole, 3.6% down on the previous December's figure. For the capital goods industries, the index fell 4. 5%, giving a seasonally-a djusted pro-duction index for December of 109.9, whe-reas in Novem-ber it had stood at 111.3 and in Janua-ry 1992 at Production Index EUR12 total l.7'11, paper Ind. 1.6% ebemlcal Ind. food Ind. ear lad....,. metallic article. tenlle Ind. eloctr. -,t-. 115.0. The seasonally-adjusted EC production index fell by 1.6% in the fourth quarter of 1992 compared with the third quarter. The seasonally-adjusted figures for industrial output in the EC Member States are as follows (rate of change for the past three months compared with previous three months, with the capital goods indu-Manuscript completed on = 15.03.1993 For further information please contact: FELDMANN stries in brackets): Denmark -5.9% (-5.0%); Greece -1.9% (-8.7%); Italy -1.7% (-3.8%); Belgium -0.8% (estimated) (+4.3%); Germany (West) -2.9% (-3.4%); France -1.4% (-2.7%); Netherlands -1.2% (-3.6%); United Kingdom +0.9% (+0.5%); Ireland +4.8% (esti-mated) (+8.0%). Production is therefore falling in very many Member States. In the USA, industrial production saw a slight increa-se of 0.9% (rate of change for the past three months compared with the previous three months); in Japan it fell slightly (an estimated 0.2%). Production of the various types of goods was as follows in the European Community (rate of change for the past three months compared with the previous three months): • Intermediate goods: -1.6% (USA: +0.6%), • Capital goods: -1.6% (USA: +1.7%), • Consumer goods: -1.0% (USA: +1.3%). It can be seen that the downturn in the EC economy is reflected equally in all sectors, whilst in the USA the capital goods industries are gaining momentum. The year-on-year rates of change (1992/1991) for industrial production (NACE 1-4) in the EC Member States and in the European Community as a whole currently stand as follows: EURl 2: -1.1 %; Ireland 10.1 %; Denmark 1.4%; Belgium 0.5%; Netherlands 0.1 %; United Kingdom -0.3%; France -0.9%; Greece -1.0%; Spain -1.3%; Italy -1.6%; Luxembourg -1.8%; Germany (West) -2.0%; Portugal -2.2%. |